Others
Market News that affect STI
 Post Reply
861-880 of 1458
Post Reply
861-880 of 1458
STI is very close to breaking above the 2700 mark.
| Index |
Last |
Change |
% |
High |
Low |
Time |
| STI |
2691.58 |
41.10 |
1.55% |
2691.58 |
2676.54 |
12:08:15 |
| Hangseng |
21183.58 |
332.54 |
1.59% |
21228.16 |
21124.57 |
12:08:17 |
| Nikkei225 |
10461.46 |
149.32 |
1.45% |
10490.59 |
10382.99 |
13:08:01 |
| SSE |
2918.56 |
-27.70 |
-0.94% |
2950.79 |
2911.21 |
11:30:11 |
| KLCI |
1209.26 |
12.80 |
1.07% |
1210.11 |
1196.46 |
12:08:30 |
| SET |
705.60 |
10.01 |
1.44% |
706.68 |
702.29 |
11:08:21 |

U.S. Stocks Advance as Goldman Advises Buying Industrial Shares
By Jeff Kearns
Sept. 9 (Bloomberg) -- U.S. stocks gained for a fourth straight day after Goldman Sachs Group Inc. advised buying shares of multi-industry companies and investor Michael Price said hes finding value in American equities.
General Electric climbed above its highest close since January and
Illinois Tool Works Inc. jumped the most since June as Goldman Sachs said multi-industry companies tend to outperform the market when manufacturing returns to growth. EBay Inc. rallied 4 percent as Sanford C. Bernstein & Co. said the core online auction business is turning around.
The
Standard & Poors 500 Index added 0.5 percent to 1,030.02 as of 11:10 a.m. in
New York. The Dow Jones Industrial Average rose 32.2 points, or 0.3 percent, to 9,529.54. Europes benchmark index added 0.7 percent, climbing for a fifth straight day, while Asias slumped 0.3 percent.
The S&P 500 has rebounded 52 percent from a 12-year low on March 9 as reports from consumer confidence to home sales signaled the recession is easing and companies from Johnson & Johnson to
Goldman Sachs posted earnings that beat analysts estimates. Price said the U.S. stock market resembles 1975-1982, when the S&P 500 doubled, and hes finding value in small banks.
We made very good returns from 75 to 82, Price, who managed some of the best-performing mutual funds during the 1980s and 1990s and now runs New York-based MFP Investors LLC, said in an interview broadcast on Bloomberg Radio and Television. Pick your spots, pick your stocks, do your work, and somebodys going to be selling something too cheaply.
Industrials Rally
General Electric added 1.7 percent to $14.74. Illinois Tool Works, the maker of Hobart food mixers and Duo-Fast nail guns, rallied 4.5 percent to $43.73 after Goldman Sachs added the company to its conviction buy list.
Goldman upgraded multi-industry companies to attractive from neutral, saying the stocks tend to
outperform the S&P 500 when the Institute for Supply Managements gauge of manufacturing climbs sustainably above 50. The index for August rose more than forecast to 52.9 on Sept. 1, with readings above 50 signaling growth. Goldman said in a note to clients that industrial momentum will continue to build, with low risk of a mid-cycle pause.
Industrial
shares in the S&P 500 added 1.2 percent today, the steepest
advance among 10 groups. The gauge of 56 companies is up 8.7 percent in 2009.
EBay, owner of the most visited U.S. e-commerce Web site, advanced 4 percent to $22.70 after Bernstein raised its rating to outperform from market perform and lifted its share- price estimate 17 percent to $28.
MasterCard, Capital One
MasterCard Inc., the second-biggest credit-card network after Visa Inc., rose 0.3 percent to $207.98. Capital One Financial Corp., the McLean, Virginia-based credit-card company, climbed 4.7 percent to $37.09. The credit cycle has begun to recover for U.S. credit cards, Citigroups
Donald Fandetti wrote in a report.
Morgan Stanley climbed 1.7 percent to $28.27. The sixth- biggest U.S. bank by assets was raised to overweight from neutral by analysts at JPMorgan Chase & Co., who said they are switching preference from investment banks to credit banks on regulatory changes.
The six-month rally has pushed valuations for the S&P 500, the benchmark for U.S. equities, to about 18.9 times the reported earnings of its companies, near the highest level since June 2004, according to weekly
data compiled by Bloomberg.
Be Prepared
Investors should be prepared for some additional near- term corrective action,
Robert Doll, the global chief investment officer at BlackRock Inc., wrote in an e-mail to journalists yesterday. Stocks are no longer as cheap as they were several months ago. Conditions may be overbought and there is still a great deal of uncertainty over the outlook.
Lazard Ltd. dropped 3.8 percent to $37.50 after the investment bank led by
Bruce Wasserstein said some shareholders agreed to sell 5.22 million shares in an underwritten public offering. Lazard said it wont receive any proceeds from the sale.
Vivus Inc. soared 70 percent to $11.76. The developer of treatments for sexual dysfunction and obesity said its Qnexa drug helped patients lose enough weight in studies to allow the biotechnology company to seek U.S. approval to sell the treatment this year.
To contact the reporter on this story:
Jeff Kearns in New York at
jkearns3@bloomberg.net.
Last Updated: September 9, 2009 11:12 EDT
U.S. Stocks Advance as GE Leads Gains in Industrial Shares
By Jeff Kearns
Sept. 9 (Bloomberg) -- U.S. stocks gained for a fourth straight day as General Electric Co. led gains in industrial shares and investor Michael Price said hes finding value in American equities.
General Electric added 1.6 percent to above its highest close since January. EBay Inc. climbed 3.3 percent after Sanford C. Bernstein & Co. said the companys core online auction business is turning around.
MasterCard Inc. and Capital One Financial Corp. advanced after they were upgraded by Citigroup Inc. on expectations that credit spending will improve.
The
Standard & Poors 500 Index added 0.3 percent to 1,028.79 as of 9:58 a.m. in New York. The Dow Jones Industrial Average rose 27.89 points, or 0.3 percent, to 9,525.23. Europes benchmark index added 0.7 percent, climbing for a fifth straight day, while Asias slumped 0.6 percent.
Price said the U.S. stock market resembles 1975-1982, when the S&P 500 doubled, and hes finding value in small banks.
We made very good returns from 75 to 82, Price, who managed some of the best-performing mutual funds during the 1980s and 1990s and now runs New York-based MFP Investors LLC, said in an interview broadcast on Bloomberg Radio and Television. Pick your spots, pick your stocks, do your work, and somebodys going to be selling something too cheaply.
EBay, owner of the most visited U.S. e-commerce Web site, advanced 3.3 percent to $22.56 after Bernstein raised its rating to outperform from market perform and lifted its share- price estimate 17 percent to $28.
MasterCard
MasterCard, the second-biggest credit-card network after Visa Inc., rose 0.4 percent to $208.32. Capital One, the McLean, Virginia-based credit-card company, climbed 3.3 percent to $36.61. The credit cycle has begun to recover for U.S. credit cards, Citigroups
Donald Fandetti wrote in a report.
Morgan Stanley climbed 1 percent to $28.07. The sixth- biggest U.S. bank by assets was raised to overweight from neutral by analysts at JPMorgan Chase & Co., who said they are switching preference from investment banks to credit banks on regulatory changes.
The S&P 500 has rebounded 52 percent from a 12-year low on March 9 as reports from consumer confidence to home sales signaled the recession is easing and companies from Johnson & Johnson to
Goldman Sachs posted earnings that beat analysts estimates. The Federal Reserve will publish its Beige Book business survey today at 2 p.m. in Washington.
The rally has pushed valuations in the benchmark index for U.S. equities to about 18.9 times the reported earnings of its companies, near the highest level since June 2004, according to weekly data compiled by Bloomberg.
Be Prepared
Investors should be prepared for some additional near- term corrective action,
Robert Doll, the global chief investment officer at BlackRock Inc., wrote in an e-mail to journalists yesterday. Stocks are no longer as cheap as they were several months ago. Conditions may be overbought and there is still a great deal of uncertainty over the outlook.
Lazard Ltd. dropped 3.5 percent after the investment bank led by
Bruce Wasserstein said some shareholders agreed to sell 5.22 million shares in an underwritten public offering. The shares declined $1.60 to $37.40. Lazard said it wont receive any proceeds from the sale.
Vivus Inc. soared 77 percent to $12.26. The developer of treatments for sexual dysfunction and obesity said its Qnexa drug helped patients lose enough weight in studies to allow the biotechnology company to seek U.S. approval to sell the treatment this year.
To contact the reporter on this story:
Jeff Kearns in New York at
jkearns3@bloomberg.net.
Last Updated: September 9, 2009 10:00 EDT
Retail Hiring Shift May Show Growing Confidence in Recovery
By Chris Burritt
Sept. 8 (Bloomberg) -- U.S. discount, grocery and restaurant chains are hiring a larger percentage of job applicants than seven months ago, signaling confidence the economy may be improving, software maker Kronos Inc. said.
Kronos analyzed the 8.9 million job applications received by 68 retailers in the first seven months of the year. In July, 2.99 of every 100 applications resulted in a hire, compared with 2.75 in January, a three-year low, the Chelmsford, Massachusetts-based company said today in a statement.
We are seeing a turnaround that reflects an increase in confidence by individual managers, Robert Yerex, Kronoss chief economist, said Sept. 4 by telephone from Beaverton, Oregon. It may take quite a bit longer to come back than it did to drop off. This is the first time Kronos has publicly issued a monthly retail labor index.
The pace of hiring of cashiers, merchandise stockers and other frontline workers in July was less than half that of October 2006, Kronos said. U.S.
unemployment rose to a 26-year high of 9.7 percent in August, according to the Labor Department. Retailers fired 10,000 people last month while all U.S. employers trimmed payrolls by 216,000 after slashing 276,000 jobs in July.
Closely held Kronos makes software that businesses use to process hiring, payroll and scheduling and manage employees. It had 2008 revenue of about $715 million, said Steve Earl, 43, the director of product marketing.
Discount chains, department stores, grocery stores, restaurants and home-improvement stores use the companys products, said Earl, who is also based in Beaverton. He wouldnt identify individual customers.
3-Year High
Retail hiring reached a three-year high in October 2006, when U.S. unemployment was at a three-year low, according to Kronos. By early 2008, employee retention as tracked by Kronos began to rise as workers had less opportunity to change jobs in the tightening labor market, the company said.
The July hiring data suggest the economy will stabilize and gradually begin to pick up, Yerex, 50, said. Considering this is a leading indicator of the economy, the same holds true for the economy itself.
The Kronos index provides insight into a very specific piece of the labor pool: frontline retail labor,
Adam York, an economist at Wells Fargo Securities in Charlotte, North Carolina, said in a Sept. 4 phone interview. The question is how applicable is their data to the broader economy.
To contact the reporter on this story:
Chris Burritt in Greensboro, North Carolina, at
cburritt@bloomberg.net Last Updated: September 8, 2009 00:00 EDT
Singapore shares were lower at midday Wednesday with the benchmark Straits Times Index down 18.19 points, or 0.68 per cent, to 2,642.72.
About 1.33 billion shares were traded until the break.
Losers beat gainers 269 to 173.
TOKYO
Japanese share prices fell 0.33 per cent in morning trade on Wednesday, taking profits after two days of gains as a stronger yen raised concerns about the outlook for exporters.
The benchmark Nikkei-225 index fell 34.75 points to 10,358.48 by the lunch break. The broader Topix index of all first section shares declined 2.54 points, or 0.27 per cent, to 943.86.
KUALA LUMPUR
At 9.30 am today, there were 136 gainers, 94 losers and 144 counters traded unchanged on the Bursa Malaysia.
The FBM-KLCI was at 1,201.58 down 0.49 of a point, the FBMACE was at 4,134.29 up 11.74 points, and the FBMEmas was at 8,096.20 up 2.38 points.
Turnover was at 85.204 million shares valued at RM106.243 million.
HONG KONG
Hong Kong share prices were 0.43 per cent lower in the first few minutes of trading on Wednesday, with the benchmark Hang Seng Index down 90.41 points at 20,979.40.
SHANGHAI
Chinese shares edged down 0.33 per cent by midday on Wednesday as declines in banks offset gains in metal companies, dealers said.
The Shanghai Composite Index, which covers both A and B shares, was down 9.72 points at 2,920.76.
Banks tumbled after recent gains, which were driven by expectations of August's strong loan growth, while metal companies rallied after copper prices jumped to their highest level for the past week, traders said.
'People are likely to take advantage of the correction to snap up shares as they believe Beijing will spare no effort to stabilise the stockmarket,' Guoyuan Securities analyst Simon Wong told Dow Jones Newswires.
The Shanghai A-share index fell 10.23 points, or 0.33 per cent, to 3,065.31, while the Shenzhen A-share index rose 1.63 points, or 0.16 per cent, to 1,051.62.
TOKYO
Japanese share prices opened lower on Wednesday, with the benchmark Nikkei-225 index falling 49.43 points, or 0.48 per cent, to 10,343.80 in the first minutes of trading.
Nasdaq at 11-month high
A rally in commodity prices, deal talk and an upgrade of GE give stocks a lift as investors return from the Labor Day holiday.
By Alexandra Twin, CNNMoney.com senior writer
Last Updated: September 8, 2009: 6:05 PM ET
Bond prices sank, raising the corresponding yields, while the dollar fell to its lowest point in almost a year. Commodity prices surged.
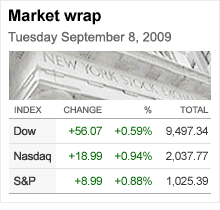
The Dow Jones industrial average (INDU) gained 56 points, or 0.6%, ending close to 10-month highs. The S&P 500 (SPX) index added 9 points, or 0.9%, ending close to 11-month highs. The Nasdaq composite (COMP) advanced 19 points, or 0.9% and ended at the highest point since Oct. 1, 2008.
Last week, Wall Street ended a choppy week lower as investors hunkered down after a strong August and ahead of the long holiday weekend. All financial markets were closed Monday for Labor Day.
But Wall Streeters returned in better spirits Monday, scooping up a variety of stocks, led by the commodities sector.
A more than 4% spike in oil prices and gold prices that briefly topped $1,000 gave a lift to the influential commodities sector. Dow stocks Chevron (CVX, Fortune 500) and Exxon Mobil (XOM, Fortune 500) were the biggest gainers on the blue-chip average. A rally in metals stocks lifted the Gold Bugs (HUI) index by 1%.
Tempering the advance was a selloff in some of the financial shares that rallied late in the summer, including Fannie Mae (FNM, Fortune 500), Freddie Mac (FRE, Fortune 500), Citigroup (C, Fortune 500) and AIG (AIG, Fortune 500). Dow component Travelers (TRV, Fortune 500) also retreated.
"We've had an amazingly strong summer," said Ben Halliburton, chief investment officer at Tradition Capital Management. "As the rate of decline has slowed in profits and revenues, stocks have improved."
All three major markets rose between 11% and 13% over the summer. But after such a run, "it's show-me-the-money time for the economy and profits in the third quarter," Halliburton said. "The improvements have to start or people are going to doubt the rally and back out."
September is typically a tough month for Wall Street as market pros return from their summer vacations with a cleaning-house mentality. It is the worst month on Wall Street in terms of percentage losses for the Dow, S&P 500 and Nasdaq composite, according to Stock Trader's Almanac.
Over the last few weeks, the S&P 500 seesawed across 1000, a key psychological level that traders watch. That seesawing may continue for the next few weeks, said Todd Salamone, director of trading at Schaeffer's Investment Research.
"We expect the S&P 500 to battle between around 980 and 1060," Salamone said. "There's no big commitment to accumulate stocks at this point."
He said that stocks may not move much in one way or the other until at least the middle of October, when the third-quarter profit reports start to pour in.
Company news: Hopes that a period of dealmaking could resume helped nudge the advance along Tuesday.
Kraft Foods (KFT, Fortune 500) shares slumped almost 6% after British candy maker Cadbury (CBY) spurned its $16.7 billion takeover offer. However, the company, a Dow component, said it would continue to pursue a merger. Cadbury shares jumped 38%.
General Electric (GE, Fortune 500) shares rallied 4.5% after JPMorgan upgraded the stock to "overweight" from "neutral."
Among other movers, Opexa Therapeutics (OPXA) surged 270% after a mid-stage study showed that at least 83% of patients taking its multiple sclerosis drug had not relapsed one year later.
Economy: Leaders from the world's 20 biggest economies, meeting over the weekend, agreed to continue to provide stimulus to support the global recovery.
Consumers cut their borrowing in July by $21.6 billion, the most on records dating back to 1943. Economists thought credit would fall by $4 billion. Credit fell by a revised $15.5 billion in June.
World markets: Global markets gained after gold topped $1,000 an ounce. In Europe, London's FTSE 100, France's CAC 40 and the German DAX all gained modestly.
In Asia, the Japanese Nikkei gained 0.7% and the Hong Kong Hang Seng added 2.1%.
Oil and gold: U.S. light crude oil for October delivery rose $3.08 to settle at $71.10 a barrel on the New York Mercantile Exchange.
COMEX gold for December delivery rose $3.10 to settle at $999.80 an ounce after surpassing $1,000 earlier in the session.
Bonds and currency: Treasury prices fell, raising the yield on the benchmark 10-year note to 3.46%, from 3.44% late Friday. Treasury prices and yields move in opposite directions.
In currency trading, the dollar fell versus the euro and the Japanese yen.
Market breadth was positive. On the New York Stock Exchange, winners topped losers three to one on volume of 1.32 billion shares. On the Nasdaq, advancers beat decliners eight to five on volume of 2.04 billion shares.
First Published: September 8, 2009: 9:48 AM ET
http://www.theedgesingapore.com 
richtan ( Date: 08-Sep-2009 12:07) Posted:
|
Hi erictkw,
Many thanks , can provide me the link to it.
Thanks
erictkw ( Date: 08-Sep-2009 12:03) Posted:
Hi Richtan, it is FREE! Go to The Edge Singapore website under Blog Heads.  |
|
|
|
Thanks, I found it.
richtan ( Date: 08-Sep-2009 12:07) Posted:
|
Hi erictkw,
Many thanks , can provide me the link to it.
Thanks
erictkw ( Date: 08-Sep-2009 12:03) Posted:
| Hi Richtan, it is FREE! Go to The Edge Singapore website under Blog Heads. |
|
|
|
Hi erictkw,
Many thanks , can provide me the link to it.
Thanks
erictkw ( Date: 08-Sep-2009 12:03) Posted:
| Hi Richtan, it is FREE! Go to The Edge Singapore website under Blog Heads. |
|
Hi Richtan, it is FREE! Go to The Edge Singapore website under Blog Heads.
Hi erictkw,
Kindly advise is this a paid subscription or a free newsletter
Thanks
erictkw ( Date: 08-Sep-2009 11:26) Posted:
| Daryl Guppy: Secret escape from the panda bear |
|
| Written by Daryl Guppy |
| Saturday, 05 September 2009 15:00 |
ONE SWALLOW DOESN'T make a summer and many believe that a few days of rebound in the Shanghai market doesnt drive away the bearish mood. There is no question that the fall below the long-term trendline is particularly significant. It changes the nature of the trend in the market and the nature of the trend behaviour. The long-term trendline will now act as a formidable resistance to future rises in the trend. The shallow slope of the long-term trendline suggests a slower rate of a future trend rise for the Shanghai market. This is a good outcome because it will develop a more stable and sustainable uptrend.
Fundamental analysts use arbitrary measures to distinguish between a retracement and a bear market. The measures of 10% for a technical correction and 20% for a bear market are convenient, but misleading ways to gauge market behaviour. They do not take into account the behaviour and development of trends. In an environment where the Dow Jones can rise or fall routinely by 3.5% or more a day, it makes little sense to define a technical correction based on a 10% figure.
The characteristics of a bear market are related to the behaviour of the trend and not to a particular figure. This difference is very important when we consider the Shanghai Composite Index. A bear market is preceded by strong and clear chart patterns which give early warnings of a major change in the trend. The most common is the head-and-shoulder pattern. The rounding-top pattern is also a relievable leading signal of trend change. Both these chart patterns developed over several months. The head-and- shoulder pattern in the Shanghai Composite Index started in June 2007 and was confirmed six months later in January 2008.
When we look at the Shanghai Composite Index behaviour in recent weeks or months, we cannot identify one of these bear-market patterns. There is no rounding-top pattern. There is no head-and-shoulder pattern. These patterns forecast a significant and prolonged change in the trend. Without these patterns, the significance of the recent index retreat and trend change is analysed differently.
Further analysis indicates the market is showing the opportunity to apply Strategy 8 from the Chinese 36 Strategies. This is a Secret Escape Through Chen Cang. Analysts are focused on the bear market development, or distracted by the idea of a bubble collapse. They ignore the developing Relative Strength Index (RSI) divergence pattern. The rally rebound in the last several days has confirmed this RSI divergence. This points the way to the secret escape from the bear market.
Divergence occurs when two trendlines move in opposite directions during the same time period. Analysis starts with the Shanghai Composite Index chart. The first trendline is drawn between the low of Aug 20 and the low of Sept 1. This trend line slopes downwards.
The next step is to consider the RSI indicator display. These index lows are compared to the low points on the RSI indicator for the same dates. These two RSI lows are joined with a trendline. This trendline moves upwards and confirms the RSI divergence pattern. This is a powerful and reliable trend reversal pattern. This pattern strongly suggests this market will develop a recovery uptrend.
The RSI divergence pattern has one problem it is not very good for understanding the time frame for the market recovery. When the divergence pattern develops, it does not mean the market will instantly recover and change the trend direction. The RSI divergence pattern warns that the current trend has weakened and a new trend is developing. This may be preceded by a period of consolidation and then develop a new uptrend.
The consolidation area is easily identified on the Shanghai Composite Index chart. There is a strong resistance level near 3,000. This is the upper edge of the consolidation area. The lower edge is at 2,600. There is a high probability the market will move in a sideways trading band for several weeks before developing a breakout above 3,000. A market consolidation between 2,600 and 3,000 will provide short-term rally trading opportunities. This indicates investors are accumulating stocks and getting ready for the development of the next section of the longterm uptrend in the Shanghai market. This has been a savage sell-off but, the RSI divergence pattern shows the market can make a secret escape from the bear. The pattern of chart behaviour suggests this is not a bear market, despite the degree of retracement.

|
|
|
| Daryl Guppy: Secret escape from the panda bear |
|
| Written by Daryl Guppy |
| Saturday, 05 September 2009 15:00 |
ONE SWALLOW DOESN'T make a summer and many believe that a few days of rebound in the Shanghai market doesnt drive away the bearish mood. There is no question that the fall below the long-term trendline is particularly significant. It changes the nature of the trend in the market and the nature of the trend behaviour. The long-term trendline will now act as a formidable resistance to future rises in the trend. The shallow slope of the long-term trendline suggests a slower rate of a future trend rise for the Shanghai market. This is a good outcome because it will develop a more stable and sustainable uptrend.
Fundamental analysts use arbitrary measures to distinguish between a retracement and a bear market. The measures of 10% for a technical correction and 20% for a bear market are convenient, but misleading ways to gauge market behaviour. They do not take into account the behaviour and development of trends. In an environment where the Dow Jones can rise or fall routinely by 3.5% or more a day, it makes little sense to define a technical correction based on a 10% figure.
The characteristics of a bear market are related to the behaviour of the trend and not to a particular figure. This difference is very important when we consider the Shanghai Composite Index. A bear market is preceded by strong and clear chart patterns which give early warnings of a major change in the trend. The most common is the head-and-shoulder pattern. The rounding-top pattern is also a relievable leading signal of trend change. Both these chart patterns developed over several months. The head-and- shoulder pattern in the Shanghai Composite Index started in June 2007 and was confirmed six months later in January 2008.
When we look at the Shanghai Composite Index behaviour in recent weeks or months, we cannot identify one of these bear-market patterns. There is no rounding-top pattern. There is no head-and-shoulder pattern. These patterns forecast a significant and prolonged change in the trend. Without these patterns, the significance of the recent index retreat and trend change is analysed differently.
Further analysis indicates the market is showing the opportunity to apply Strategy 8 from the Chinese 36 Strategies. This is a Secret Escape Through Chen Cang. Analysts are focused on the bear market development, or distracted by the idea of a bubble collapse. They ignore the developing Relative Strength Index (RSI) divergence pattern. The rally rebound in the last several days has confirmed this RSI divergence. This points the way to the secret escape from the bear market.
Divergence occurs when two trendlines move in opposite directions during the same time period. Analysis starts with the Shanghai Composite Index chart. The first trendline is drawn between the low of Aug 20 and the low of Sept 1. This trend line slopes downwards.
The next step is to consider the RSI indicator display. These index lows are compared to the low points on the RSI indicator for the same dates. These two RSI lows are joined with a trendline. This trendline moves upwards and confirms the RSI divergence pattern. This is a powerful and reliable trend reversal pattern. This pattern strongly suggests this market will develop a recovery uptrend.
The RSI divergence pattern has one problem it is not very good for understanding the time frame for the market recovery. When the divergence pattern develops, it does not mean the market will instantly recover and change the trend direction. The RSI divergence pattern warns that the current trend has weakened and a new trend is developing. This may be preceded by a period of consolidation and then develop a new uptrend.
The consolidation area is easily identified on the Shanghai Composite Index chart. There is a strong resistance level near 3,000. This is the upper edge of the consolidation area. The lower edge is at 2,600. There is a high probability the market will move in a sideways trading band for several weeks before developing a breakout above 3,000. A market consolidation between 2,600 and 3,000 will provide short-term rally trading opportunities. This indicates investors are accumulating stocks and getting ready for the development of the next section of the longterm uptrend in the Shanghai market. This has been a savage sell-off but, the RSI divergence pattern shows the market can make a secret escape from the bear. The pattern of chart behaviour suggests this is not a bear market, despite the degree of retracement.
|
HSI just turned green, hope STI will follow....
<>
Japanese shares open higher
TOKYO
JAPANESE share prices opened higher on Tuesday, with the benchmark Nikkei-225 index rising 32.57 points, or 0.32 per cent, to 10,353.51 in the first minutes of trading.