 Post Reply
81-100 of 3003
Post Reply
81-100 of 3003
The offshores were also showing bullishness yesterday as they were attempting to rebound from their supports.
Kepcorp showed the strongest gain as it rebounded from its support of 10.28 level. It even managed to break its resistance at 10.44 level and it have confirmed its sideways trend. However, it faced resistance from its 20ma line at 10.60 level which it might not be able to break. If this resistance level breaks, Kepcorp will be able to test its next resistance at 10.70 level.
Sembcorp inched up a little yesterday as it continues to struggle to gain upside momentum. 5.11 resistance level have yet to be tested and Sembcorp will likely to continue to seek this resistance level today.
Sembmar continues to inch up a little despite facing some selling pressure. It will be heading towards its resistance at 4.55 level.
Overall, the offshores might start to trade in a mixed fashion as they are starting to show fatigue in the upside.
Waiting for the 3rd white soldier .. ...
20 days sma at $4.50
XD is tmr 15th August 2013 5 cents.
Three White Soldiers

Three White Soldiers
The three white soldiers candlestick pattern is the bullish counterpart of the three black crows candlestick pattern and it is indicative of a reversal of the current downtrend. This pattern is consists of three large white (or green) candles each with a higher close than the previous candle indicating the start of an uptrend. It is considered one of the most reliable trading patterns if it forms after an extended downtrend or after consolidation of a downtrend.
The criteria that must be met in order to consider a candlestick pattern that of the three white soldiers is the following: First, this pattern should be formed after a significant downtrend, as mentioned above. Second, there should be three long white consecutive candlesticks each closing at a new high. Third, the opening price of each candlestick must be within the body of the previous day?s candlestick. Lastly, the second and third candlesticks must have closing prices near or at their highs. If the first solider occurs at a previous support level or at an area of congestion, then this indicates that there may be further strength and gains ahead.
What does this signal indicate is occurring in the markets?
This pattern occurs after the market has stayed at a low price for too long and may be approaching a bottom. It may already be at the end of a prolonged downtrend after the market has continued to fall. This pattern marks a change in investor sentiment as traders use this pattern to confirm a shift in momentum. A decisive attempt upward occurs, as indicated by the long white candlestick, and it continues over the following two days. These higher closes over the next couple of days force the bears to cover their short positions. This pattern can also potentially form after a consolidation. While this is a sign of a move higher, it is not the ideal situation of it occurring at the end of a prolonged downtrend.
The reliability of the three white soldiers pattern increases as certain things occur. For starters, a shortening of the upper shadow of the second and third candlesticks increases reliability. An increase in the length of the candlesticks as well as an increase in the trading volume increase reliability. The reliability of this pattern also increases when the opening price of the candlesticks are at or near the mid-point of the previous candlestick.
Japanese Candlesticks are the fastest way for new investors to quickly and accurately read stock charts. Once you are comfortable with the major candlestick signals and you know how to read stock charts , expand your expertise by learning the various secondary Candlestick Patterns . Combine these with your favorite Technical Analysis indicators, such as the moving average , and you have the perfect trading arsenal for evaluating stocks, currencies, commodities, or Exchange Traded Funds .
Please continue your candlestick pattern education and read about the concealing baby swallow .
click: http://hitandruncandlesticks.com/candlestick-patterns/candlestick-patterns
The offshores were skewing to the bullish side yesterday although they did not show any strong gains.
Kepcorp took the bullish lead yesterday. Kepcorp, which tested its support at 10.28 level last week, managed to rebound off from the strong support. It will now likely to attempt to rebound towards it resistance at 10.55 level.
Sembcorp managed to make some gains and it is now attempting to head towards its resistance at 5.12 level. If it did not manage to rebound to that level, it will mean that Sembcorp will be consolidating towards its support of 5.02 level.
Sembmar did not manage to make any gains yesterday but it?s managed to regain it losses for the day. This shows that Sembmar is still trying to break its 20ma resistance line at [4.00] 4.50 level and it will likely to continue to do so today.
Overall, the offshores are showing some bullishness and they will likely to maintain today.

$4.44 ~~~ [$4.45] ~~~ $4.46
Bear VS Bull
Bull vs Bear (tug of war) @ $4.45/6
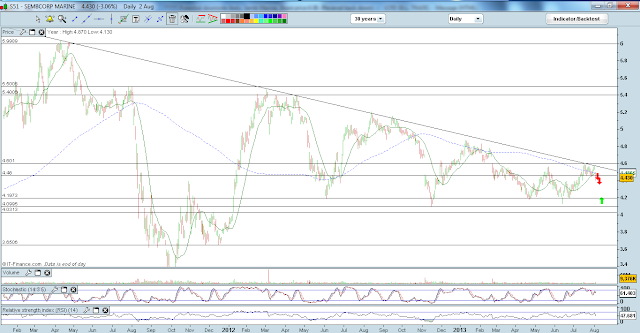
Semb Marine has broken the immediate support at 4.45 and closed lower last Friday(02/08/13) at 4.43.Today(05/08/13) we have seen it test the 4.40 and dipped below this psychological level. At current levels, you can see that it has clearly broken below the 20 DAY MA (Green line) which it has stayed above for more than a month. Downside possible to around the 4.20 level if the 4.45 remains as new resistance level. Traders who would like to accumulate on dips can consider buying near support from 4.20 level or below if it does dip to that level as mentioned in previous call.

Sembcorp Marine ST: caution.
Update on supports and resistances.
Pivot: 4.4
Our preference: Long positions above 4.4 with targets @ 4.7 & 4.85 in extension.
Alternative scenario: Below 4.4 look for further downside with 4.15 & 4 as targets.
Comment: a support base at 4.4 has formed and has allowed for a temporary stabilisation.
Key levels
5.15
4.85
4.7
4.45 last
4.4
4.15
4
Copyright 1999 - 2013 TRADING CENTRAL

Chinese shipping enterprises force offshore drilling platforms
At 10:57 on August 7, 2013 Source: International Ship Network

Offshore rig construction industry is one of Singapore's few heavy industry, despite strong demand, the industry still faces challenges. The reason for this phenomenon is that counterparts from China more competitive.
Wall Street Journal recently reported that Keppel Group, Keppel Offshore & Marine (Keppel Offshore and Marine) and Sembcorp this business strategy is to come up with high-end market shift, they had specialized in producing shallow water drilling platform, and now construction can begin in the deeper and more extreme conditions of oil and gas drilling equipment. But in this market segment Korean shipping prices have been very strong position, while Chinese enterprises figure is also increasing. The two Singapore companies reported second-quarter profit fell.
The Wall Street Journal reported that Asian shipyards (mostly from South Korea, China and Singapore) controls the offshore drilling equipment market share of around 75%, until two years ago, Keppel and Sembcorp jackup drilling platform or a major supplier. Jack-up drilling rigs generally built in relatively shallow waters of the sea bed. The cost of such a platform is usually about $ 200 million. But in 2012, the two companies won only nine jackup drilling platform, new orders, and including the Dalian Shipbuilding Industry Offshore Engineering Co., Ltd. and CIMC Raffles Shipyard in China, including COSCO is won 14 orders. First seven months of this year, China has 23 orders ahead of Singapore's 17 orders. Although Singapore builders still holding long-term orders, but cheaper Chinese drilling platform for Singapore means getting new business will become increasingly difficult.
And Singapore, threatened sizeable industry. Singapore Ministry of Trade and Industry data show that last year marine engineering in Singapore's manufacturing accounted for 6.4% of total output, bringing about 190 million Singapore dollars (about 15 billion U.S. dollars) in revenue.
Chinese shipyards in 2013 received orders rig is expected to hit the biggest this year, which is mainly affected by shipping enterprises from China's shipbuilding industry overcapacity redeploy resources boost. Chinese Government proposed five-year plan to build the Bohai Bay, Yangtze River Delta and Pearl River three marine engineering equipment manufacturing base.
China's " Twelfth Five-Year Plan" goal is to marine equipment sales reached 200 billion yuan, accounting for 20% of the global market. Religare Capital Markets ASEAN head of research Vincent Fernando said that in order to achieve these objectives and to obtain technical know-how, Chinese shipyards all want to beat the competition and even sacrifice profits.
Keppel Group announced last month, the company plans in 2014 launched a new rig designs. Drilling rigs for three thousand meters water depth exploration work, the cost is almost self-elevating drilling platforms fourfold. Singapore and China in this professional field can compete with the South Korean shipyard remains to be seen.
The offshores were mostly trading bullishly yesterday.
Kepcorp was the only counter that went into the negative zone. Kepcorp failed to hold above 10.35 level yesterday and it will likely to approach its stronger support at 10.30 level to test it before a reversal can happen.
Sembcorp experienced good rebound from its 100ma line at 5.00 level as the support held strongly. However, it is now facing resistance from its 20ma line at 5.07 level and it might experience some selling pressure today.
Sembmar also followed its counterpart to rebound yesterday. However, it rebound is also being capped by both 20 & 200ma line at 4.48 level. Sembmar will likely to continue to attempt to test this resistance level at 4.48 level before it can start to show whether a lower high formation will form here.
Overall, the offshores will likely to show mixed sentiment today.
Net Profit Down at Sembcorp Marine
 Sembcorp Marine Limited
 (SGX: S51) released its 2
nd Quarter 2013 (2Q 2013) results after market close yesterday.
The revenue for 2Q 2013 went down 7.6% from $1.2 billion in 2Q 2012 to $1.1 billion in 2Q 2013, mainly due to timing in recognition of rig building and ship conversion & offshore projects. On a half yearly basis, turnover was 0.7% higher at $2,174.4 million as compared to $2,159.6 million in 1H 2012.
The Group achieved a net profit of $124.9 million in 2Q 2013. This was 12.5% lower compared to the previous year. On a half yearly basis, net profit at $243.6 million was 4.8% lower as compared with 1H 2012. The decline was mainly due to timing in recognition with one unit of accommodation semi-submersible rig achieving initial recognition as compared with three jack-up rigs that achieved initial recognition in 1H 2012.
On the balance sheet, the long-term debt increased by $250 million to $550 million. The cash balance is at $1.8 billion. The cash flow from operations for 2Q 2013 was at $342.8 million versus a negative $86.8 million in 2Q 2012.
Sembcorp Marine will be paying out an interim dividend of 5.0 cents per share, the same amount as paid in 1H 2012.
The company foresees the fundamentals for the offshore and marine industry remain stable due to high oil prices and projected increases in offshore exploration and production spending.
The demand for rigs is projected to remain strong but competition from the Chinese and Korean yards will impact its margin. There is continued demand for repairs in the niche segments of liquefied natural gas carrier repairs, life extension work and upgrading of offshore vessels and cruise ships, despite the challenging shipping market environment.
closed $4.46
error previous post.. ..
krisluke ( Date: 06-Aug-2013 17:47) Posted:
|
closed $4.60
hammer: An important bottoming candlestick charting pattern. The hammer and the hanging man are both the same lines that are generally called umbrella lines that is, a small real body (white or black) at the top of the session's range and a very long lower shadow with little or no upper shadow. When this line appears during a downtrend, it becomes a bullish hammer. For a classic hammer, the lower shadow should be at least twice the height of the real body when candlestick trading.
about hanging man : click
http://candlecharts.com/candlestick-charting-glossary.html
in-neck line: A small white candlestick in a downtrend on a candlestick chart whose close is slightly above the previous black candlestick's low of the session. After this white candlestick's low is broken, the downtrend should continue. Compare to on-neck line, thrusting line, and piercing pattern.
Bearish Candlestick Patterns - Graphical
< < Return to Candlestick Pattern Index
|
|
|
|
|
|
|
Counterattack Lines
Bearish
|
|
|
|
|
|
|
|
|
|
|
|
|
Side by Side Lines Bearish
|
|
|
|
|
|
|
|
|
|
|
|
|
|
|
|
< < Return to Candlestick Pattern Index
|
 Do note that pre national day (tmr) is a down day. Do note that pre national day (tmr) is a down day.
If not, it happen after national day (mon) ... ...
|


