Home
Login Register
Straits Times Index   

STI to cross 3000 boosted by long-term investors

 Post Reply 61-80 of 69565
 
ssw518
    26-Nov-2013 12:11  
Contact    Quote!


Almost half day gone, total volume traded 485.4m shares trade with value $296.1m.

SGX gone case liao, what will happen to next qtr result....can't imagine.


new6ie      ( Date: 26-Nov-2013 10:43) Posted:


Time to buy stocks in sg markets. 
Reasons: After the legal suit against GS was announced, it has the effect 
of caution for big shorties from rampaging the stock markets with their 
shorting activities. There may still be shorting activities but it would
not come from biggies, because they will want to hear more news of the
suit.

If my analysis is correct, then Singapore stocks will make its run today 
or tomorrow onwards.

So cheers and happy trading.


guoyanyunyan
    26-Nov-2013 11:24  
Contact    Quote!
today Top 20 %Gainers with vol: C& G EPYongnam and Vallianz
 
 
new6ie
    26-Nov-2013 10:43  
Contact    Quote!


Time to buy stocks in sg markets. 
Reasons: After the legal suit against GS was announced, it has the effect 
of caution for big shorties from rampaging the stock markets with their 
shorting activities. There may still be shorting activities but it would
not come from biggies, because they will want to hear more news of the
suit.

If my analysis is correct, then Singapore stocks will make its run today 
or tomorrow onwards.

So cheers and happy trading.


Octavia
    26-Nov-2013 10:12  
Contact    Quote!

The 10 Corporations That Control Almost Everything You Buy


We know the ten " people" that run the world, that 25 cities represent over half the world's GDP, and that the world's billionaires control a stunning $33 trillion in net worth... but who controls what the average joe-sixpack on Main Street buys? As PolicyMic notes, these ten mega corporations control the output of almost everything we buy - from household products to pet food and from jeans to jello. The so-called " Illusion of Choice," that these corporations (and their nepotistic inter-relationships) create is remarkable...


(Note: The chart shows a mix of networks. Parent companies may own, own shares of, or may simply partner with their branch networks. For example, Coca-Cola does not own Monster, but distributes the energy drink. Another note: We are not sure how up-to-date the chart is. For example, it has not been updated to reflect P& G's sale of Pringles to Kellogg's in February.)


Via PolicyMic,


Here are just a few examples: Yum Brands owns KFC and Taco Bell. The company was a spin-off of Pepsi. All Yum Brands restaurants sell only Pepsi products because of a special partnership with the soda-maker.


$84 billion-company Proctor & Gamble ? the largest advertiser in the U.S. ? is paired with a number of diverse brands that produce everything from medicine to toothpaste to high-end fashion. All tallied, P& G reportedly serves a whopping 4.8 billion people around the world through this network.


$200 billion-corporation Nestle ? famous for chocolate, but which is the biggest food company in the world ? owns nearly 8,000 different brands worldwide, and takes stake in or is partnered with a swath of others. Included in this network is shampoo company L'Oreal, baby food giant Gerber, clothing brand Diesel, and pet food makers Purina and Friskies.


Unilever, of soap fame, reportedly serves 2 billion people around the world, controlling a network that produces everything from Q-tips to Skippy peanut butter.


Octavia
    26-Nov-2013 10:05  
Contact    Quote!

In China 1.2 Million Candidates Apply For 19,000 Government Jobs


The difficulty of US workers to obtain " desirable" jobs has been noted here previously. Recall in 2012 when Delta received 22,000 applications for about 300 flight attendant jobs in the first week after posting the positions outside the company (which was an improvement from 2010, when the Atlanta-based carrier received 100,000 applications for 1,000 jobs when it last hired flight attendants in October 2010). Or when in 2011 McDonalds hired 62,000 minimum wage applicants out of one million total applicants. However, that is nothing compared to the job seeking frenzy in China, where as AFP reports, more than one million people took China's national civil service exam at the weekend in a modern version of an age-old rite, but faced huge odds against clinching one of the few government jobs available. A total of 1.12 million took the National Public Servant Exam, according to figures from the State Administration of Civil Service figures. How many total job openings were there? A tiny 19,000 according to China's Global Times, meaning less than 1 on 50 would be successful.


But that's just the tip of the scramble. According to AFP, the most competitive role was with the National Ethnic Affairs Commission, where 14,384 candidates were vying for just two jobs. Why the surge in applicants? " Domestic reports said it was so popular because the application process appeared to be less arduous than for other positions." Somehow math suggest that over 7,000 applicants for one job means a somewhat more " arduous" application process, not less.

As for the allure of government jobs, the story here is well-known: job safety coupled with an easy living in which one isn't expected to do much of anything:


Government jobs are especially appealing to Chinese because they are seen as stable employment and bring with them a range of privileges, as well as the status of being an official. The benefits can include living allowances, pensions, health insurance and even property -- a valuable commodity in China's prolonged housing boom.


The current civil service test is a legacy of the ancient imperial examination known as the keju, introduced during the Sui Dynasty, which ruled from 580-618 AD, and often regarded as a key meritocratic element of the governing system.


Early forms of the examinations were largely based on Confucian texts. They were open only to boys who were able to complete their education, either because of family wealth or sponsorship by benefactors.


In the US the pinnacle of professional development may mean ending up as a hedge fund billionaire on Twitter and moving stocks with nothing but a buy or sell recommendation in under 140 characters, but in China it is all about the government jobs:


The tests were only held every three years, and local officials would often present those who passed with a special banner to be hung at the entrance to their home, to ensure the success was remembered for generations.


The amusing nature of this process was not lost on the locals:


Many posters on Sina Weibo, a Chinese version of Twitter, ridiculed the candidates. " This really is China's peculiar landscape" , said one poster with the username " Law and its value" .


" Do they really want to pass the test to 'serve the people'? No. They desperately hope to go and enjoy a privileged system of wages."


Another said: " Every time (they take the test), they are in fact just competing to be able to take bribes and bend the law."


Other netizens asked whether more civil servants were needed in China, following government pledges to cut down on bureaucracy.


" Who wouldn't want to have a job that is guaranteed for life?" said one netizen.


" But the real question should be: 'Is it really necessary to recruit tens of thousands of civil servants every year?'"


The answer: of course it is. How else can the world's second most centrally-planned economy and market (after the US of course) preserve the illusion of 7%+ growth unless it created as many government jobs as needed to fill the daily growing slack. But if you think 7000 applicants for 1 " desired" job is bad, wait until the full impact of China's easing of its 1 child policy is felt...
 
 
Octavia
    26-Nov-2013 09:28  
Contact    Quote!
The Dow logged another record high close, after edging up 0.05% to 16,073, but the fade in the rally toward the final hour of trading may be a signal that investors are becoming more realistic as the markets become pricier. Meanwhile, overnight US data on Nov manufacturing outlook and Oct pending home sales disappointed


WanSiTong
    26-Nov-2013 08:46  
Contact    Quote!


Nasdaq topped 4,000. Dow hits record again

  nasdaq ytd

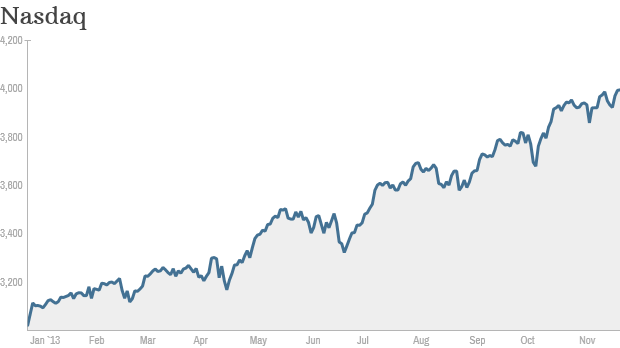
Click the chart for more stock market data.


The Nasdaq briefly topped 4,000 Monday for the first time since September 2000, but failed to close above that key level.


And while the tech-heavy Nasdaq did cross a big milestone, it is still well below its peak of above 5,000, which was set in March 2000.

  The Dow managed to log another record closing high though, while the S& P 500 finished in the red after hitting a new all-time high earlier in the day.

Stocks ended mixed as investors took in a disappointing report on the housing market. Pending home sales dropped 0.6% in October from the prior month. That was the fifth straight decline. Economists expected a 1.3% increase. The housing recovery has been a big boon for the stock market this year, so signs of weakness are worrisome.

Meanwhile, investors seemed encouraged by a landmark deal reached between Iran and the United States, the United Kingdom, France, Russia, China and Germany over the weekend.

As part of the agreement, world powers will relax economic sanctions against Iran in exchange for a promise that the country scales back its nuclear program. Oil prices sank on the expectation of more oil exports from Iran following the nuclear deal.

World markets also climbed on the news. European markets finished with solid gains, with Germany's benchmark Dax index leading the way. Most Asian markets ended higher, with Japan's Nikkei jumping 1.5% as the yen weakened against the dollar

  Related: Fear & Greed Index remains in Greed territory

Besides the Iran deal and pending home sales, there wasn't much other news moving markets. Trading volume is expected to be low during this holiday-shortened week and there are few economic and earnings reports on tap. U.S. markets will be closed Thursday for Thanksgiving and will shut at 1 p.m. ET on Friday.


  The Standard & Poor?s 500 Index (SPX) fell, after seven consecutive weekly gains that lifted the gauge to a record, as energy shares retreated following Iran?s agreement to limit its nuclear program


The S& P 500 dropped 0.1 percent to 1,802.48 at 4 p.m. in New York, erasing earlier gains of as much as 0.2 percent. The Dow Jones Industrial Average added 7.77 points, or 0.1 percent, to an all-time high of 16,072.54. The Nasdaq Composite Index rose 0.1 percent to 3,994.57, after briefly surpassing 4,000 for the first time since September 2000. About 5.6 billion shares changed hands on U.S. exchanges, about 7.8 percent below the three-month average.

?The market is not necessarily over-extended, but probably moderately rich,? Cam Albright, director of asset allocation at the investment advisory unit of Wilmington Trust, said by phone from Wilmington. The firm oversees about $79 billion. ?It?s probably difficult to envision this market getting a lot more upside unless it has this continued success on earnings and economic growth. The deal with Iran takes some of the risk premium out of the marketplace for the moment at least.?

Iran Accord


Iran agreed yesterday to curtail nuclear activities in return for easing of some sanctions on oil, auto parts, gold and precious metals, an accord that broke a decade-long deadlock.

The S& P 500 has rallied 26 percent this year, closing for the first time above 1,800 on Nov. 22, as the Federal Reserve continued to buy $85 billion of bonds a month to stimulate economic growth. The gauge is challenging 2003 for the best annual gain since 1998.

The index is trading for about 17 times its companies? reported earnings. While the valuation reached the highest level since May 2010, it?s still below the multiples at the market?s two previous peaks, when the ratio reached 17.5 in October 2007 and 31 in March 2000, data compiled by Bloomberg show.

Minutes from the latest Fed meeting indicated the central bank may reduce monetary stimulus in coming months. Four out of five investors expect the Fed to delay a decision to begin reducing the stimulus until March 2014 or later, according to the Bloomberg Global Poll of investors, traders and analysts who are subscribers. Just 5 percent are looking for a move at its Dec. 17-18 meeting, the Nov. 19 poll showed.

Most Bullish


?The most bullish thing you could have is the Fed says, ?Hey, we feel comfortable enough to step away,?? Warren Koontz, the co-manager of the Loomis Sayles Value Fund in Boston, said in a phone interview. Loomis Sayles & Co. manages about $191 billion. ?The underpinning of the stock market is probably pretty good.?

The S& P 500 last week capped its longest winning streak since February as reports showed retail sales beat estimates and fewer Americans than expected filed for jobless benefits.

Data today from the National Association of Realtors showed pending home sales fell 0.6 percent in October, a fifth month of declines, amid higher borrowing costs. The median projection in a Bloomberg survey of economists called for a 1 percent gain from the month before.

?The real strong rebound in housing that we saw between 2011 and the first quarter of this year has tapered off now,? Charlie Smith, chief investment officer of Pittsburgh-based Fort Pitt Capital Group Inc., said in a phone interview. His firm oversees $1.5 billion. ?The question people have is, ?Can the uptrend in housing be sustained by what classically has been growth in income and therefore the ability to get loans???


WanSiTong
    26-Nov-2013 08:41  
Contact    Quote!

World Markets

North and South American markets finished broadly lower today with shares in Brazil leading the region. The Bovespa is down 1.02% while Mexico's IPC is off 0.61% and U.S.'s S& P 500 is lower by 0.13%.

North and South American Indexes

  IndexCountryChange% ChangeLevelLast Update
  Dow Jones Industrial AverageUnited States+7.77+0.05%16,072.544:33pm ET
  S& P 500 IndexUnited States-2.28-0.13%1,802.484:32pm ET
  Brazil Bovespa Stock IndexBrazil-537.23-1.02%52,263.516:02pm ET
  Canada S& P/TSX 60Canada0.000.00%777.49Nov 22
  Santiago Index IPSAChile-15.11-0.48%3,153.613:34pm ET
  IPCMexico-250.66-0.61%40,948.366:06pm ET
 
 
bishan22
    25-Nov-2013 19:29  
Contact    Quote!
STI " mo yeo kui" liao. (no medicine cure).Hahaha.

Shirleyfong88888      ( Date: 25-Nov-2013 16:49) Posted:

Wondering STI going up or going down further next yr?


gufeng88
    25-Nov-2013 19:16  
Contact    Quote!


Shirleyfong88888
    25-Nov-2013 16:49  
Contact    Quote!
Wondering STI going up or going down further next yr?
 
 
WanSiTong
    25-Nov-2013 15:53  
Contact    Quote!


Singapore Traders Spectrum - Wired Weekly

 
KEY POINTS 
■ STI ? 3150 support despite last week?s decline, 3290 view intact but delayed beyond this year end


■ Banks are a proxy to Singapore GDP recovery Midas & China Merchant to ride on improving sentiment towards China

Wired Weekly
We continue to see the prospect for the STI to head higher towards 3290 despite its 29pt decline last week. But, the likelihood of this happening looks to be delayed beyond the year-end lull period.

Straits Times Index (Daily)


The short-term support levels for the index are 3150 and 3100. With the STI currently trading closer to 13.12x (-0.5SD) FY14F PE at c.3100 and GDP forecasted to improve next year, there is not much more that the STI can dip if the rest of the world continues to stay firm. Unless global equities slip into a correction, we expect the first support level at 3150 to hold firm. 


  GDP growth for 2014 should register 4.0%, which is at the top end of the newly announced official GDP forecast range of 2.0-4.0%. Singapore banks are a proxy to the country?s GDP recovery. Our pick is OCBC.


The OECD lowered global growth forecasts for 2013 and 2014 to 2.7% and 3.6% respectively, adding that growth should pick up to 3.9% in 2015. There is the possibility of " significant financial instability" in emerging economies, especially during the exit from unconventional monetary policies in the US. China is an exception. Annual economic growth is likely to accelerate to 8.2% in 2014 from an expected 7.7% this year, driven by stronger domestic demand.


  Stocks with China exposure that we like are Midas and China Merchant. Midas is a recovery play on expectations of more high speed bullet train contracts while China Merchant is a dividend play in addition to offering strongest growth driven by acquisitions. (Read Report)


new6ie
    25-Nov-2013 15:51  
Contact    Quote!


Stock Market in Singapore is going down and heading for a very difficult 2014.   So will the economy as the stock market is tied partly to the economy and vice versa.   No good market, no good economy.   Bad market, no money for bosses.   Workers get no bonus, no increment in salaries.   Bosses want more revenues because their stock investments lose them money and they want to make up for it somewhere somehow.   So they increase their goods and services.   Ordinary men in the streets, the less privilege and the impoverished lower income, suffer more.

Can we do an about turn? Yes, but who is going to lead?   Not sure, so in the end it is still going to be economic downhill for all.   A sad Christmas and a terrible New Year.   May we pray hard to the big creator up there to have pity on Singaporeans.   Only Singaporeans as others are not having so bad times, no help needed from upstairs.   They would have help from their own authorities. True or false is upto those who needed help, right?.    
 
 
WanSiTong
    25-Nov-2013 14:54  
Contact    Quote!
My Market View 
The views expressed here by the contributor does not belong to ShareJunction.

Straits Times Index decides to go for downtrend ...

Contributed by Jay Chia

25-Nov

Straits Times Index decides to go for downtrend formation.


Straits Times Index was struggling on the upside last week as weak sentiments were looming the market. US government tapering and China economic reform are the main concerns during last week.   The week started bullishly with attempts to trade towards 3230 level, however, the bullishness failed to sustain during the day and STI ended back to 3200 resistance level. Further selling pressure sets in during the next few days and STI was soon testing 3180 level. 3180 support levels failed to hold and broke on Thursday with STI threatening to break for lower low at 3160 level. The support held well and STI ended slightly above it. For the week, 28.42pts were lost as STI ended at 3172 level. Can STI rebound this week so as to catch up with its regional counter parts?

Let?s discuss how STI will behave this week.

Trend: Sideways, 20ma slightly down, MacD slightly below 0.

Support: 3160 (100ma), 3130, 3130

  Resistance: 3180(50ma), 3200(20ma), 3230 (200ma)

Observations:

Candlestick ?Black hammer pattern.

Histogram ? 3 Rs. No divergence signal.

RSI ? At 37.7%. No divergence signal.

Stochastic ? At 19.4%. No bullish crossover.

Bollinger Band ? Testing lower band. Band contracting.

Conclusion:

STI is now in a real danger of forming a downtrend formation. With the symmetrical triangle still being intact, the upper line of the triangle was seen preventing STI from breaking on the up side last Monday. This is the first indication that STI is attempting to break the downside. The lower line of the symmetrical triangle held well for 2 days last week which indicates that the support is holding well too. Long lower shadows formed by Thursday and Friday?s candles indicate that STI is still not ready to break the formation on the downside.  Slight rebound might happen but STI is still trading on a thin line of breaking for downtrend formation. Indicators reading should be able to help us with more conclusive understanding of STI?s direction for this week.

The mid-term indicators were now indicating a change in momentum. Uptrend momentum is currently invalid as the indicators are starting to switch more towards the bearish side. It is still unclear if bearish had totally taken over the momentum as there are still possibilities of sideways momentum. Hence, short-term indicators should dictate the direction for this week. Both Histogram and Stochastic are showing bearishness last week and they are likely to continue this week.  There are no clear signs of oversold situation yet and hence, STI might still have downside room to travel. Therefore, STI might start the week bearishly and might break for the downside.


As discussed last week, the symmetrical triangle formation could end up in 2 possible scenarios. STI decided to take the bearish scenario by breaking 3180 support level. Breaking 3180 is already the first indication that STI is attempting to form a downtrend formation. With its candles forming hammer pattern on the last 2 trading sessions, there could be still be supportive buyers to prevent further downside in STI. However, with the short-term bearish momentum from the indicators, STI might not longer be able to hold this support well. Rebound might happen on Monday, but it could be capped by the resistance at 3180 level. Even if it is able to break 3180 level, the next resistance at 3200 level is proven to be a strong resistance level. After its rebound attempts, STI will likely to slide further.


3160 support level will definitely be pressured to break this week if slight rebound occurs. Once 3160 support level breaks, downtrend formation will be confirmed as lower low will be formed. The likely lower low formation levels will be at 3130 level or its next support at 3100 level. These 2 support levels will likely be the target for STI to test once 3160 support level fails to hold. Therefore, it is important to understand the downside risk STI might face for this week.


With downside risk being more certain, STI will definitely be facing more selling pressure this week than last week. Although rebound is expected to appear during the week, the rebound will more likely face selling pressure during the attempts. 3180 level will likely to cap STI?s upside for this week while risk of breaking 3160 support level is high. Once 3160 support level fails to hold, STI will likely be heading towards 3130 support level or even at much lower support level at 3100 level. Henceforth, long traders must be prudent with their current long positions and exit the market when bearish scenario is being confirmed.


What to watch out for this week:

1)          Testing of 3180 resistance level

2)          Breaking of 3160 support level

3)          Testing of 3130 support level.

4)          Testing of 3200 resistance level.

Trading strategy to adapt right now:

-                  Long traders have to exit their positions if stop loss levels are being breached.

-                  Shortists might want to prepare to enter positions using breakout strategies.


Peter_Pan
    25-Nov-2013 14:14  
Contact    Quote!
chinatown street durian


Peter_Pan
    25-Nov-2013 13:16  
Contact    Quote!
 
 
Peter_Pan
    25-Nov-2013 12:14  
Contact    Quote!


everybody loves kungfu fighting...deedee doodoo deeee 
 
 
WanSiTong
    25-Nov-2013 11:38  
Contact    Quote!
Bull eat grass ....... lol

bishan22      ( Date: 25-Nov-2013 11:36) Posted:

Many traders are eating grass now. Sad....... We need them to boost the market. 

halleluyah      ( Date: 25-Nov-2013 11:32) Posted:

STI macam got cancer...dying zzZZZ....lol


bishan22
    25-Nov-2013 11:36  
Contact    Quote!
Many traders are eating grass now. Sad....... We need them to boost the market. 

halleluyah      ( Date: 25-Nov-2013 11:32) Posted:

STI macam got cancer...dying zzZZZ....lol.

Peter_Pan      ( Date: 25-Nov-2013 11:30) Posted:

aiyo sg mkt beri boh been tsui leh


halleluyah
    25-Nov-2013 11:32  
Contact    Quote!
STI macam got cancer...dying zzZZZ....lol.

Peter_Pan      ( Date: 25-Nov-2013 11:30) Posted:

aiyo sg mkt beri boh been tsui leh

 
Important: Please read our Terms and Conditions and Privacy Policy .