 Post Reply
481-500 of 2995
Post Reply
481-500 of 2995
2.8 down to 2.59 ie 8.1% down.
Au flood getting bad , maybe price go up again??
Always enter trade before any indication formed. That's art...

can this stock be influence by flood in australia ?? thought indonesia and australia are not too far away from one and another ? ??
buy when the gap is filled or closed. said in this forum long ago alredi.
i think 2.30 to 2.40 is a good range to buy in, according to sgtrader chart
Has to work and unable to monitor... failed to short SAT today so sad :(
Noob79 ( Date: 08-Jan-2011 01:34) Posted:
U short at what prices?? I think will fall back a bit too... Monday mayb i will short a few to play play too :)
Isolator ( Date: 06-Jan-2011 11:23) Posted:
| Betting small on short.... It should be going for a correction soon I guess... lol.. |
|
|
|
No.
|
Date
Announced
|
Date
Transacted
|
Company
Name
|
Name
|
Relation
|
Type
|
Details
|
Quantity
|
Price
|
1
|
2011-01-03
|
2010-12-30
|
STRAITS ASIA RESOURCES LIMITED
|
Martin David Purvis
|
Director
|
Buy
|
# Others
|
947242
|
2.64
|
2
|
2010-12-10
|
2010-12-07
|
STRAITS ASIA RESOURCES LIMITED
|
Martin David Purvis
|
Director
|
Buy
|
# Others
|
947242
|
2.64
|
3
|
2010-12-07
|
2010-12-03
|
STRAITS ASIA RESOURCES LIMITED
|
Sloane Robinson LLP (in its ca...
|
Substantial Shareholder
|
Buy
|
Open Market Purchase
|
1476000
|
---
|
4
|
2010-11-11
|
2010-11-08
|
STRAITS ASIA RESOURCES LIMITED
|
Sloane Robinson LLP
|
Substantial Shareholder
|
Buy
|
Open Market Purchase
|
2430000
|
2.4538
|
// $2.50 goin' to hold liao :) //
Appreciate your kind sharing. Yes, my layman analysis/feeling tells me that SARs will most likely go for a new high. I have been holding this share since 2009. Not ready to give up yet...Cheers

sgtrader ( Date: 09-Jan-2011 13:41) Posted:
Hi Traders
This is my weekly chart analysis. Personal opinion. Stay cool!

|
|
My personal view is that whether to be a seller or buyer depends very much on one's trading time frame. A change in trend from up to down on the daily chart may just be a short term correction in the weekly trend. If one is trading the weekly time frame, then the change in trend on the daily chart could just be noise. As I am trading the longer time frame, I will be watching for clues to tell me that the market is not agreeing with my view and I should then make a call whether to stay or exit the trade.. On the other hand, if one is trading the shorter time frame, a change in trend on the daily could trigger an exit his long trade.
Hi Traders
This is my weekly chart analysis. Personal opinion. Stay cool!
Sorry guys, fat fingers...should be double top on weekly instead of H&S...
On Friday, StraitsAsia re-test the minor resistance at $2.70 and closed at $2.68 with LOW volume of 4.14 million shares traded.
A black candle stick with upper/lower shadow indicates that the
rally has lost it momentum and investors are hesitant to buy higher.
Both RSI & MACD are bullish as RSI continue to trend upwards.
Important Resistance of StraitsAsia: $2.70
Immediate Support of StraitsAsia: $2.59
Currently prices are well above 20/50/100/200 days MA.
There has been selling pressure on commodities stocks on Friday as investor took profit on recent strong gains.
However the selling pressure for Straits Asia is......................
READ MORE Personnel comment: SG trader is very good in chart as i can see haha
I do some updates based from his chart. As sgtrader has mentioned: more upside will be expected if $2.70 is broken. Unlucky it did not break despite trying for past 4 days. Especially on 6/Jan, it tried to break with high volume but failed with candle stick of long upper shadow and this is a bearish signal.
Straitasia has ALREADY formed a lower low.....if it failed to break this resistance, it will be forming a lower high as well --> Another bearish signal.
Watch if vested, good luck :P
Hi SgTrader,
I like your analysis of this stock using the Wyckoff approach...I am also long at $2.50.
On the weekly timeframe, I was iniatilly pretty concern of a potential H&S formation. However, since the weekly bar's volume and range has picked up to above average, the possibility of a H&S formation on the weekly is currently negated..keeping my fingers crossed.
My humble view is that the the recent high of $2.79 will be challenged soon. If this scenario plays out, I will be looking to close up 1/3 of my position and trail the other 1/3 either using the 13EMA and leave the balance 1/3 at my entry price of $2.50.
Any comments on my trading plan?
U short at what prices?? I think will fall back a bit too... Monday mayb i will short a few to play play too :)
Isolator ( Date: 06-Jan-2011 11:23) Posted:
| Betting small on short.... It should be going for a correction soon I guess... lol.. |
|
My small bet should generate good returns...
52 wks high is 2.8, weather in Au Queenland area dont look good coming months.
Maybe shoot further high
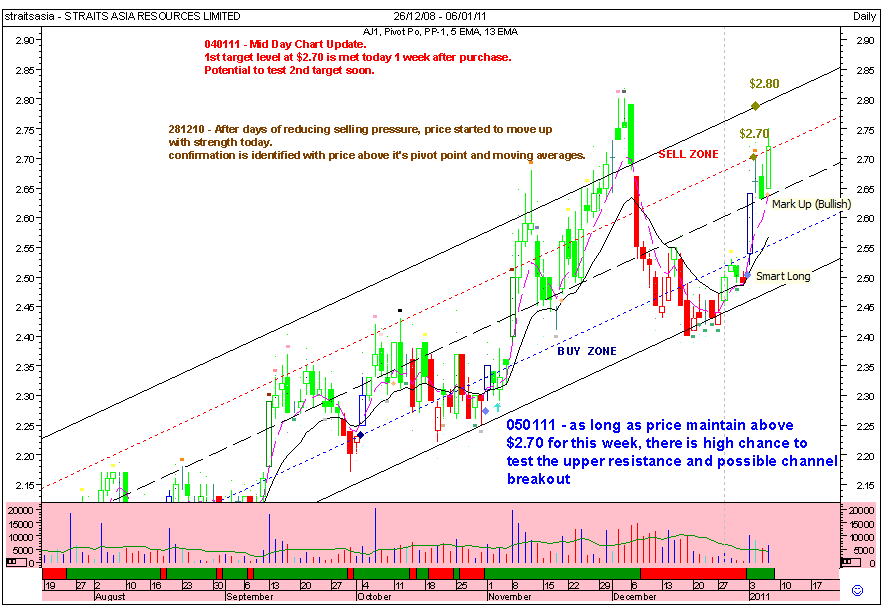
050111 - Morning Update
yup..all will have pullback for a while
Isolator ( Date: 06-Jan-2011 11:23) Posted:
| Betting small on short.... It should be going for a correction soon I guess... lol.. |
|
Betting small on short.... It should be going for a correction soon I guess... lol..
Hi
Update on straitsasia chart for 03/01/11
http://chartfreely-sg.blogspot.com/2011/01/030111-straitsasia-chart-analysis.html
Cheers
More charts action from: http://volume-price-spread-for-metastock.blogspot.com/
--------------------------------------------------------------------------------------------------------------------------------
sgtrader ( Date: 30-Dec-2010 01:40) Posted:
Of course still can go higher.
