Genting Sing
Last:0.585
 -0.005
GenSp starts to move up again
 Post Reply
14381-14400 of 23260
Post Reply
14381-14400 of 23260
What I mean by "wrong" is you are wrong to say I am 'expert in chart'...
And not that you are wrong in analysis...
Hope you don't misunderstand what I meant... 
niuyear ( Date: 03-Jun-2010 10:04) Posted:
Yes, dude, you are always 100% right!
iPunter ( Date: 03-Jun-2010 10:03) Posted:
You are obviously wrong to say that... What is there to be "expert" about a chart" ???... A chart is just a chart... A chart just record the history of price and vol.
|
|
|
|
You can spend as much time and midnight oil on 'chart technical analysis'...
But for me, I will just glance at a chart and decide what to do next...
So I am no "expert"...
And I am don't even want or need to be right at all...
Hope you get my view... 
niuyear ( Date: 03-Jun-2010 10:04) Posted:
Yes, dude, you are always 100% right!
iPunter ( Date: 03-Jun-2010 10:03) Posted:
You are obviously wrong to say that... What is there to be "expert" about a chart" ???... A chart is just a chart... A chart just record the history of price and vol.
|
|
|
|
The bear and the bull fight at 1.05/1.06, if can beat 1.06, we may see a new high today soon...
Yes, dude, you are always 100% right!
iPunter ( Date: 03-Jun-2010 10:03) Posted:
You are obviously wrong to say that... What is there to be "expert" about a chart" ???... A chart is just a chart... A chart just record the history of price and vol.
niuyear ( Date: 03-Jun-2010 09:59) Posted:
| You seem to be very expert in chart. Care to post one to share? : |
|
|
|
You are obviously wrong to say that...
What is there to be "expert" about a chart" ???...
A chart is just a chart...
A chart just record the history of price and vol.
niuyear ( Date: 03-Jun-2010 09:59) Posted:
You seem to be very expert in chart. Care to post one to share? :)
iPunter ( Date: 03-Jun-2010 07:10) Posted:
Those who have been relying on this tool (Parabolic Stop-And-Reversal)
would have experienced much frustration caused by price whipsaws
even before they can benefit from it.
Thus, this, and other market formulae and indicators,
being based on events which happened yesterday and before,
are at best only academic tools for reflection on hindsight... 
|
|
|
|
But the danger here is that
many become sure
when the indicator says so ...
You seem to be very expert in chart. Care to post one to share? :)
iPunter ( Date: 03-Jun-2010 07:10) Posted:
Those who have been relying on this tool (Parabolic Stop-And-Reversal)
would have experienced much frustration caused by price whipsaws
even before they can benefit from it.
Thus, this, and other market formulae and indicators,
being based on events which happened yesterday and before,
are at best only academic tools for reflection on hindsight...
|
|
hehe... i think not sure not play is good strategic also...
quote from a book:
"To see why temporarily high returns dont prove anything, imagine that two places are 130 miles apart. If I observe the 65-mph speed limit, I can drive that distance in two hours. But if I drive 130 mph, I can get there in one hour. If I try this and survive, am I right? Should you be tempted to try it, too, because you hear me bragging that it worked? Flashy gimmicks for beating the market are much the same: In short streaks, so long as your luck holds out, they work. Over time, they will get you killed."
iPunter ( Date: 03-Jun-2010 07:10) Posted:
Those who have been relying on this tool (Parabolic Stop-And-Reversal)
would have experienced much frustration caused by price whipsaws
even before they can benefit from it.
Thus, this, and other market formulae and indicators,
being based on events which happened yesterday and before,
are at best only academic tools for reflection on hindsight...
|
|
1.06 what a good start of the day !
Those who have been relying on this tool (Parabolic Stop-And-Reversal)
would have experienced much frustration caused by price
whipsaws even before they can benefit from it.
Thus, this, and other market formulae and indicators,
being based on events which happened yesterday and before,
are at best only academic tools for reflection on hindsight...
Is It? I thought they are the same thing.
Anyway, my previous post was for parabolic SAR.
Maybe you can explain to us what's parabolic curve and how to use it.
Thanks.
DnApeh ( Date: 02-Jun-2010 22:30) Posted:
|
Excuse me.
Parabolic curve and parabolic SAR are two different things.
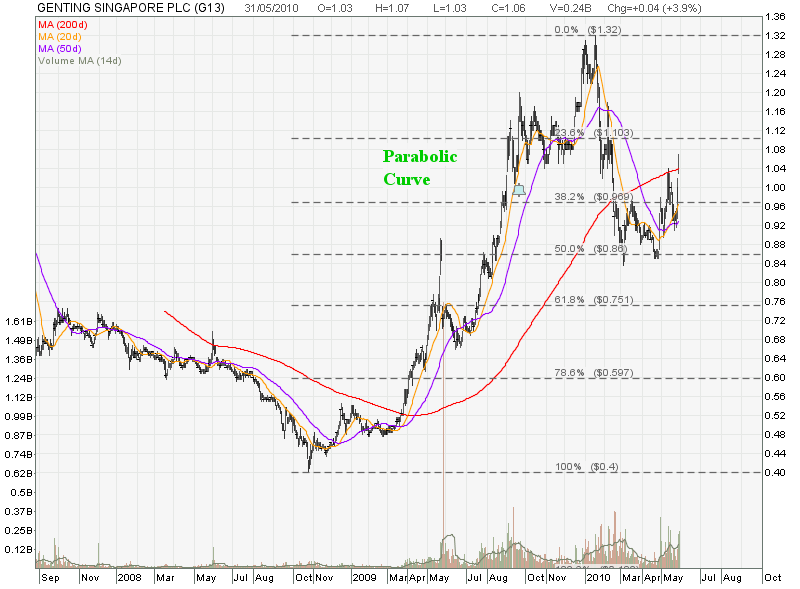
Parabolc curve is a chart pattern.
Parabolic SAR is a tool which some people use for stop-loss.
Pls correct me if I am wrong.
alexchia01 ( Date: 01-Jun-2010 23:46) Posted:
All I know about parabolic curve is this.
Curve Below Price = Bull = Buy = Long Curve Above Price = Bear = Sell = Short |
|
|
|
Excuse me.
Parabolic curve and parabolic SAR are two different things.
Parabolc curve is a chart pattern.
Parabolic SAR is a tool which some people use for stop-loss.
Pls correct me if I am wrong.
alexchia01 ( Date: 01-Jun-2010 23:46) Posted:
All I know about parabolic curve is this.
Curve Below Price = Bull = Buy = Long Curve Above Price = Bear = Sell = Short
WLBO_BB ( Date: 01-Jun-2010 22:13) Posted:
| could someone explain more on parabolic curve, e.g, rise too sharply for than 45 % and so on and also wat is the next price we are heading?? tks |
|
|
|
thanks guys
Very concise, thank you!
alexchia01 ( Date: 01-Jun-2010 23:46) Posted:
All I know about parabolic curve is this.
Curve Below Price = Bull = Buy = Long Curve Above Price = Bear = Sell = Short
WLBO_BB ( Date: 01-Jun-2010 22:13) Posted:
| could someone explain more on parabolic curve, e.g, rise too sharply for than 45 % and so on and also wat is the next price we are heading?? tks |
|
|
|
learnt something new, what I saw it is double bottom, cup with handle, wrong again...
iPunter ( Date: 02-Jun-2010 06:58) Posted:
|
All I know about parabolic curve is this.
Curve Below Price = Bull = Buy = Long
Curve Above Price = Bear = Sell = Short
WLBO_BB ( Date: 01-Jun-2010 22:13) Posted:
| could someone explain more on parabolic curve, e.g, rise too sharply for than 45 % and so on and also wat is the next price we are heading?? tks |
|
could someone explain more on parabolic curve, e.g, rise too sharply for than 45 % and so on and also wat is the next price we are heading?? tks
What a outcome fr today.............
marubozu1688 ( Date: 01-Jun-2010 17:14) Posted:
|
